PWP: Chicago lights up New York while Montreal feels the Impact of Sporting KC

As noted in my headline, the Chicago Fire simply lit the fireworks with the youngster Harry Shipp leading the way; good for him and well done, son!  As for the new leader in Montreal–and ex-Fire coach–things weren’t quite as rosy.

You’ll recall early last week I published this article on MLS Coaches – showing statistics, not pure speculation, on which coaches have teams that aren’t performing to standard in MLS at this time.  Frank Klopas was one of those Head Coaches mentioned, and sadly his team was the only team in the bottom four of that list who didn’t win this past weekend.

Mark Watson did with San Jose, Frank Yallop did in the obvious thriller in New York, and Wilmer Cabrera saw his Goats absolutely stun Colorado.  Sooner or later the wheat will separate from the chaff.

But back to Chicago.  They didn’t take the PWP Attacking Team of the week by much; Sporting KC was a close second while Cabrera and the Goats were 3rd best and New England rounded out the top 4 with that blowout against Seattle.

PWP Attacking Player of Week #10 – Harry Shipp – surprised?  Not likely, for only the second time this year my PWP Attacking Player of the Week was the same as the MLS Player of the Week… as odd as it may sound I take pride in my PWP Players of the Week not matching those from MLSSoccer.com.

PWP ATTACKING PLAYER OF WEEK 10

PWP ATTACKING PLAYER OF WEEK 10

A busy day for the young lad, and almost too much information to go into my standard PWP Player of the Week.

That said Sporting KC got back on track with another smashing win against Montreal.  And while they scored three goals what stood out most was their smothering defense; a leader in helping that effort was my PWP Defending Player of the Week; Chance Myers.

PWP DEFENDING PLAYER OF WEEK 10

PWP DEFENDING PLAYER OF WEEK 10

Duly noted that some players had some superb passing statistics in this game; here’s a diagram of all the successful passes for Sporting against a hapless Montreal side… and even more intriguing is this diagram (also from the OPTA Chalkboard) of all the unsuccessful passes by Sporting.  WOW!  Not sure I’ve ever seen so sparse a chalkboard as that for unsuccessful passes!

In looking at the defensive side of the pitch Montreal offered up 45 total passes in the Sporting defending third – of which nine were throw-ins… in the area here (just atop the 18 yard box) Montreal had 5 unsuccessful passes and 3 successful passes with two of those successful passes being throw-ins.

Moving on… So this week who’s top and who’s not in Possession with Purpose after 10 full weeks of play in MLS?

PWP COMPOSITE INDEX THROUGH WEEK 10

PWP COMPOSITE INDEX THROUGH WEEK 10

As a reminder, the top five Western Conference teams in the End-of-Season PWP Composite Index were the top five Western Conference teams to make the Playoffs.  In addition, the top five Eastern Conference Teams in the same Index were the top five Eastern Conference teams to make the Playoffs.

Last year’s Champion has finally reached the top spot; will they be able to hold on?  I don’t know, but still-unbeaten Real Salt Lake has shifted from 7th to 4th this week.

Columbus is starting their painful drop while Seattle, LA, and FC Dallas hover, and New England continues to push higher.

What is unique about this Index is it’s not influenced by the “next bright and shiny object” syndrome.  Teams will fade and teams will push higher, but not on a whim; I hate whims…

With respect to the bottom teams in this Index – there is no question that the worst performing team in MLS is Montreal.  I’m not sure how anyone can consider their pathetic team output – across all categories measured – anything other than worst.  

Chivas got a notable win, but one win does not a streak make – falling a bit further this week was Toronto – moving from 6th worst to 4th worst.  Are some other teams in MLS catching on to that ‘mistake driven’ football that Nelson might be working towards?

Hard to say, but with some MLS stars moving off to prepare for the World Cup, there will definitely be important lineup change, and possible some big changes to this Index in the next six weeks.

In closing:

Another busy week coming with the Canada Cup Championship plus two more games for Sporting and Philadelphia.

Two diagrams for your consideration:

PWP ATTACKING INDEX THROUGH WEEK 10

PWP ATTACKING INDEX THROUGH WEEK 10

This is the Cumulative PWP Attacking Index after week 10.

Note that the separation between the top attacking team (FC Dallas) and the 10th best attacking team (Vancouver) is 2.4984 – 2.3365 = .1619.  So when you see the overall Composite Index there really isn’t that much that separates the tenth place attacking team from the 1st place attacking team…

However, small movement is still expected given that a number of teams will be without some key players for at least 5 weeks – we can hope for more for the USMNT’s sake.

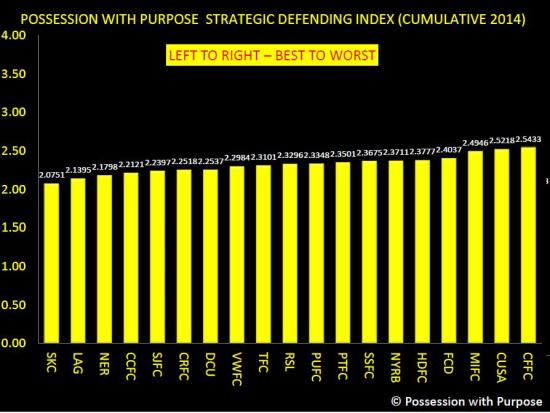
PWP DEFENDING INDEX THROUGH WEEK 10

PWP DEFENDING INDEX THROUGH WEEK 10

This information reflects how well the combined opponents of these teams performs in the Defending PWP.

In looking at the diagram what the last place team offers is that the opponents of Chicago Fire, by and large, possess the ball, pass the ball, penetrate with the ball, take shots with the ball, and score with the ball more than Chicago does… if that trend continues it is likely that Chicago will have a very poor record by the end of the season.

In considering Philadelphia for a minute – they are in the bottom half but they are not being dominated by their opponents – sometimes games won and lost or drawn end up being more about a single mistake or… multiple mistakes as opposed to poor team performance.  It’s data like this that tells me, as an analyst, that Hackworth has a reasonable system and plan – its’ just not working because something on the pitch is broken.

I think many would offer that is the same case for Portland this year – most know that 5 points were lost due to PK’s early this year, and perhaps three points were lost this past Sunday when some players simply forgot that they were soccer players and instead decided to be ball watchers…

All for now, Chris

How it Happened: Week seven

I hate to be a disappointment, but Easter weekend means I only got to review two matches instead of the usual three. One was a doozy: a premier matchup of Western Conference powers, while the other had a pretty incredible final five minutes. On to the show (and if you’re really jonesing for some analysis of Chivas-Seattle from Saturday night, I’ll probably tweet some thoughts when I catch up on it later this week).

Real Salt Lake 1 – 0 Portland Timbers

Stat that told the story for Salt Lake: 23/37 passes in attacking center of the field

Stat that told the story for Portland: 7/12 passes in attacking center of the field

rslpor7


We’re breaking new ground with this one: I’m combining both teams’ stats for this game. These two teams have had drastically different starts to the season, with RSL grinding out results against a very difficult schedule and Portland failing to do the same against an easier slate. Still, the margin of quality between these teams is pretty slim, and that fact was borne out this weekend.

From a Real Salt Lake standpoint, this game was pretty much par for the course for 2014 and really the last five seasons. Aside from a few surprising miscues in possession that gifted chances to the Timbers, RSL’s diamond midfield was good in possession and solid in defense. They found a weakness in Portland’s defense by attacking the channel to the right of the Timbers’ centerbacks (that’s where all the incisive passes above, and Ned Grabavoy’s goal, came). Even though they weren’t at their clinical best, using tiki-taka passes to break through the backline, RSL did their job and got three points at home.

As a Timbers fan, it’s yet another missed opportunity for Portland to get that elusive first win of the year. Theories of what’s plaguing the 2014 Timbers are abound, and like ghost stories or craft beers, I have my likes and dislikes. I’ll say two things on PTFC here: (1) their demise is overstated. Portland has hit the post like a million times already this year,* and the Timbers have only been outscored by four goals (coincidentally the number of penalties they’ve given up). Once those two areas regress to the mean, it’s likely the Timbers will start to earn points and earn them fast.

*Portland leads the league in posts and crossbars hit during even gamestates with four.

But that brings me to (2): the Timbers aren’t playing as well as they did for much of last season. They are a team that thrives on possession when at their best, yet they’ve been out-possessed in each of their last five games. It’s like Portland is always flooring the engine, pushing the ball vertical to rush into shots instead of occasionally using cruise control and slowing the game down. A huge issue for them in this game was their lack of penetration in attack, as illustrated by the image above. Still, the game went back and forth with Portland and RSL both controlling the game for portions, and only the quality finish by Grabavoy instead of the fluffed chances by Maxi Urruti decided the result.

Chicago Fire 1 – 1 New England Revolution

Stat that told the story for New England: Teal Bunbury playing out of position in his position

ne7

That stat above makes no sense, so I’ll let someone much wiser than me explain.

shinguardian

Bunbury has been playing up top for New England for the entirety of this season, and while he’s always been thought of as a striker, he fits better as a winger in the Revolution’s system. His speed is his greatest asset while his finishing leaves something to be desired, two sure signs that lone striker isn’t necessarily your best fit. At center forward in this one, Bunbury gave a lot of great effort and the team tried to set him off to the races behind Chicago’s backline. But it was never particularly successful. Late in the match, Bunbury was shifted out wide as Jerry Bengtson came on, and he promptly created a chance out of nothing by simply running really fast around Chicago’s left back. I’d love to see more of that and less of Bunbury struggling up top in the future for New England.

Stat that told the story for Chicago: 11 turnovers in their own half by Bakary Soumare and Jhon Kennedy Hurtado

Chicago played well enough to win this game, and probably should have. If not for a poor penalty kick in stoppage time that was easily saved by Bobby Shuttleworth, the Fire would’ve left with three points instead of yet another draw. The draws are getting to be ridiculous for Chicago (6 in 7 games!), but they really have no one to blame but themselves. In addition to the penalty fiasco, the goal they gave up immediately followed one of those 11 turnovers by Chicago centerbacks. Patrick Nyarko was the one who gave up the penalty, but Soumare and Hurtado deserve at least a share of the blame. This was hardly an isolated incident for Chicago – their centerbacks have been shaky all season. Think they regret trading away Austin Berry right about now?


Agree with my ideas? Think I’m an idiot? I love to hear feedback: @MLSAtheist

How it Happened: Week Three

In the three games I watched this week, five goals were scored. Two were from penalty kicks, and two were off corner kicks. Needless to say, offenses around the league are in early-season form, i.e. not exactly clicking in front of the net. On the bright side, there was a decent amount of combination play leading to chances….it’s just that whole putting them away thing that MLS teams are still working on. Onto the main attraction:

Chicago Fire 1 – 1 New York Red Bulls

Stat that told the story for New York: 350 completed passes; 68% of which were on the left side of the field*

nyrb3

It’s hardly inspiring for the Supporters’ Shield holders to sneak away from Chicago with a draw, but I actually thought they played pretty well on Sunday. Like I said above about the league as a whole, quality was missing on the final ball/shot, but New York fans shouldn’t be too worried about the team’s winless start. In this one there was quite a bit of good linking-up, particularly on the left flank. Given that midfielder Matt Watson was starting in a pinch as a nominal right back for the Fire, it seemed like a concerted effort from RBNY to expose a weakness on that side of the field. Between Roy Miller, Jonny Steele and Thierry Henry, there were some encouraging sequences down that side in particular; unfortunately for New York it didn’t lead to any actual goals.

*This stat/image is blatantly stolen from the Twitter account of MLS Fantasy Insider Ben Jata, @Ben_Jata. After seeing it this weekend, I was unable to think of anything better to include, so thanks, Ben!

Stat that told the story for Chicago: 24 total shots + key passes, only 2 of which were from Mike Magee

I’m not sure if this one is a good stat for Chicago fans or a bad one, but Mike Magee was conspicuously absent from a lot of the action this weekend (unless you count yelling incessantly and childishly at the ref as your definition of ‘action’). But seriously: last year Chicago had 377 shots the entire season, and Magee either took or assisted on 116 of them (31%)*. Oh, and he only played 22 of their 34 games. The fact that he was involved in only 2 of the team’s 24 shots (both of his shots were blocked, for what it’s worth) could certainly be viewed as concerning for Chicago fans expecting another MVP-caliber season out of Magee. But on the other hand, it’s easy to chalk up the struggles to the fact that this was his first game of the season after a maybe-contract-hold-out related hiatus. Also, the fact that Chicago managed to create 22 shots without Magee’s direct influence (or Patrick Nyarko and Dilly Duka, both also out this weekend) has to be a good sign for a team that was often a one-man show last season: youngsters Harrison Shipp and Benji Joya in particular both seem capable of lightening the load.

*Numbers from Squawka.


Toronto FC 1 – 0 DC United

Stat that told the story for Toronto: 38% possession, 3 points won

tfc3

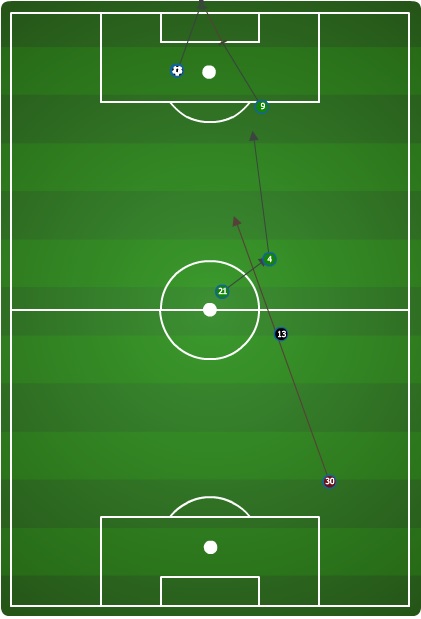
TFC captain Michael Bradley made headlines this week saying something along the lines of how possession was an overrated stat, and his team certainly appears to be trying to prove his point so far this season. The Reds didn’t see a ton of the ball in their home opener, instead preferring to let DC knock the ball around with minimal penetration in the final third. And then when Toronto did win the ball, well, check out the Opta image that led to the game’s lone goal for Jermain Defoe (or watch the video). It started with a hopeful ball from keeper Julio Cesar. The second ball was recovered by Steven Caldwell, who fed Jonathan Osorio. Osorio found his midfield partner Bradley, who lofted a brilliant 7-iron to fellow DP Gilberto. The Brazilian’s shot was saved but stabbed home by the sequence’s final Designated Player, Defoe. Balls like that one were played multiple times throughout the game by both Bradley and Osorio, as TFC has shown no aversion to going vertical quickly upon winning the ball. And with passes like that, speedy wingers, and quality strikers, it’s certainly a strategy that may continue to pay off.

Stat that told the story for DC: 1/21 completed crosses

This stat goes along a bit with what I wrote about Toronto above: they made themselves hard to penetrate in the final third, leading to plenty of incomplete crosses. Some of this high number of aimless crosses also comes from the fact that DC was chasing an equalizer and just lumping balls into the box late in the match. Still, less than 5% on completing crosses is a bit of a red flag when you look at the stat sheet. Particularly when your biggest attacking threat is Eddie Johnson, who tends to be at his best when attacking balls in the air. You’d think Ben Olsen would expect a better crossing percentage. To be fair to United though, I thought they were much better in this game than they were on opening day against Columbus. They looked about 4 times more organized than two weeks ago, and about 786 times more organized than last season, and their possession and link-up play showed signs of improvement too. Still a ways to go, but at least things are trending upward for the Black and Red.


Colorado Rapids 2 – 0 Portland Timbers

Stat that told the story for Portland: 1 Donovan Ricketts karate kick

por3

I admit that I’m cheating here and not using a stat or an Opta Chalkboard image. But the above grainy screenshot of my TV that I took is too hilarious and impactful not to include. Colorado and Portland played a game on Saturday that some might call turgid, or testy, or any number of adjectives that are really stand-ins for the word boring. The most interesting parts of most of the game were Ricketts’ adventures in goal, which ranged from dropping floated long balls to tipping shots straight in the air to himself. In the 71st minute it appeared Ricketts had had enough and essentially dropped the mic. Flying out of his net, he leapt into the air with both feet, apparently hoping that if he looked crazy enough the ref would look away in horror instead of red carding him for the obvious kick to Deshorn Brown‘s chest. The Rapids converted the penalty and then added another one a few minutes later, and that was all she wrote.

Stat that told the story for Colorado: 59 total interceptions/recoveries/tackles won; 27 in the game’s first 30 minutes

Alright, I was silly with the Portland section so I feel like I need to do a little serious analysis for this paragraph. The truth is that this game was fairly sloppy on both sides, which is particularly surprising considering how technically proficient Portland was for most of last season. But cold weather combined with early season chemistry issues makes teams play sloppily sometimes, and it didn’t help that Colorado came out and looked very good to start this game. Their defensive shape was very compact when the Timbers had the ball, and the Rapids were very proficient in closing down passing lanes and taking possession back. The momentum swung back to Portland’s side and back a couple of times throughout the match, but Colorado’s strong start set the tone that Donovan Ricketts helped carry to the final whistle.


Agree with my assessments? Think I’m an idiot? I always enjoy feedback. Contact me on twitter @MLSAtheist or by email at MLSAtheist@gmail.com

Season Preview: Chicago Fire

The Chicago Fire won MLS Cup in their first season in the league. They qualified for the playoffs in 12 of their first 13 seasons in MLS. But since 2010, they’ve made the postseason only once (in 2012), where they lost in the first round. For such a storied franchise, it’s clear that Chicago has underachieved for the last four years. Hopes in the Windy City are that a new coach with a history of success in MLS, Frank Yallop, will be able to turn around their fortunes and return the club to the promised land.

2013 Finish: 49 Points, 6th in the Western Conference, Missed MLS Playoffs

ChicagoXI

Transactions

Players In:

Name Position Acquired from:
Lovel Palmer D/M Salt Lake
Harrison Shipp F Homegrown – Notre Dame
Kyle Reynish GK New York Cosmos (NASL)
Chris Ritter M Homegrown – Northwestern
Jhon Kennedy Hurtado D Seattle
Patrick Ianni D Seattle
Giuseppe Gentile F Waiver draft – Charlotte
Benji Joya M Santos Laguna (Mexico)

Players Out:

Name Position Where’d he go?
Paolo Tornaghi GK Waived
Arevalo Rios M Option Declined
Michael Videira D Option Declined
Corben Bone M Option Declined
Joel Lindpere M Option Declined
Maicon Santos F Option Declined
Shaun Francis D Out of Contract
Wells Thompson D Out of Contract
Daniel Paladini M Columbus
Jalil Anibaba D Seattle


Median Age: 25

Median Age: 25
*Designated Player

Their 2013 was really bad followed by pretty good, but ending in disappointment. The Fire began the season looking more like kindling (sorry, that’s the only fire-related pun I’ll use in this post), losing seven of their first ten matches. But then they started making moves, both in the front office and up the table. Chicago acquired centerback Bakary Soumare from Philadelphia and forward Mike Magee from Los Angeles, and their ascent quickly followed. Soumare brought a much-needed solidity to the back line, and Magee played out of his mind for the remainder of the season in his hometown. After running off six matches unbeaten immediately following their acquisition, the Fire came back to Earth and narrowly missed out on the East’s final playoff spot, bowing to Montreal on a tiebreaker.

The season was not without its hardware though, as Magee won the league MVP trophy, despite being tradedCHIINFO


On paper, the Chicago Fire seem like they have the pieces to be a contender in the Eastern Conference. Their offseason moves didn’t floor anyone, but they do appear to have improved, both on the bench and in the coaching box. The head coach position is where Chicago made their most substantial move: out went Frank Klopas after last season, and in came Frank Yallop. Yallop won two MLS Cups with the San Jose Earthquakes as well as the 2012 Supporters’ Shield, so he certainly has pedigree to match that of his new employer.

As far as the roster he will be working with, it seems like it should fit with his general style of play pretty well. In San Jose, Yallop was well known for his team’s propensity for quality wing play and crossing it to the forwards, something to which the Fire should be fairly well-suited. In Patrick Nyarko and Dilly Duka, Chicago has two wingers that are both lightning quick and love taking on defenders. As for who they’ll be crossing to, number one on the list is reigning league MVP Mike Magee. ‘Magic Mike’ is unlikely to repeat his career year from 2013 when he scored 21 goals in stints for both Chicago and Los Angeles. But even if he doesn’t approach that number in 2014, Magee is an instinctive finisher who always seems to bag more goals than you project for him.

The other options up front are long time Fire player Chris Rolfe and the Ecuadorian Designated Player Juan Luis Anangono. Rolfe got much of the action up top alongside Magee last year, but it wouldn’t surprise me to see Anangono play a bigger role in his first full season with the club. Anangono is a big, physical presence up top that would seem to match Frank Yallop’s desired style, as he could be an asset getting on the end of crosses. Meanwhile, Rolfe is a solid technical player in his own right, but to me is a bit like a poor man’s Mike Magee. While they combined very well at times last season, having two players with fairly similar styles up top leads to diminishing returns.

The rest of the starting eleven will likely see more shakeups from last season. Along the back line, Chicago traded away Jalil Anibaba—who played every minute for the Fire last season—to Seattle in exchange for centerbacks Jhon Kennedy Hurtado and Patrick Ianni. How those two duke it out for playing time with returning starters Austin Berry and Bakary Soumare will be interesting to watch. On the outside, Costa Rican Gonzalo Segares returns to his normal left back position, while right back may be manned by newly acquired Lovel Palmer. Both of those fullbacks are solid if not spectacular options who should get the job done.

My biggest questions come in central midfield for Chicago.Jeff Larentowicz looks like a shoo-in for one of the spots there, as he has long been a solid two-way midfielder in this league. But who starts alongside him will be an interesting puzzle for Yallop to put together. Does the Brazilian Alex become a full-time starter? Does the newly acquired young starlet Benji Joya get deployed in an attacking midfield role from the get-go? Or will veteran captain Logan Pause return a starting spot to bring a strong veteran presence onto the field?

From top to bottom, the Chicago Fire look like they should be one of a host of teams competing for the playoffs in the East. They’ve done well to bring in an established MLS coach in Frank Yallop, and they have a roster without many glaring holes. If Mike Magee can deliver another MVP-caliber season, this team could vault to near the top of the Eastern Conference table. But without that, the rest of the roster is still long on solid players, but a bit short on difference-makers. Yallop’s guidance and a re-jiggered backline might just be enough to return the Fire to the playoffs, or at least another year where their playoff fate comes down to the final day of the season.

Crowdsourcing Results

6th in the Eastern Conference; the Chicago Fire were picked to make the playoffs by just 120 of 404 voters (29.7%)

A Short Exercise in the Power of a Player: Mike Magee and Juan Agudelo Observed

I asked the question on Twitter, “how many teams have been better than Chicago since the arrival of Mike Magee?” Let’s take a look at the results of games played since the acquisition of Magee on May 24th.

PPG-sinceMay24

I think we knew that the Fire have been good since the arrival of Magee, but just how good is pretty surprising. Adding to the surprise are both the Whitecaps and Revolution with 1.6 points per game.  Looking to the bottom of the table we see how far FC Dallas has dropped since their hot start to the season.

I know that we all like to think that the results in March and April are vital, and to a degree they are—there is no way that FC Dallas is even considering a run at the playoffs if it wasn’t for how they performed in Mar/Apr—however, the season is long; there are nearly 8 months and 34 games.

For now anyway…

I’ve long been of the belief that one player in soccer doesn’t make that big of a difference on an entire season and it’s table location. Sure, maybe Clint Dempsey takes Seattle from being an injury prone playoff-ish team to a contender for the Supporters Shield. But Chicago was, and is now, much better. Along with Chicago, New England’s performance needs mention too.

Currently, the minute men have 17 points through 8 matches with Juan Agudelo in the line-up. Something pointed out to me by the folks over at Deep in the Fort.  It’s also a conclusion that makes me question how much that’s true and how much a really good player can impact a season for a club.

Obviously it needs a much closer observance than a single table of points over a time period. There are other factors to consider with both clubs. Regression, sample size, ect. But there is enough there to at least consider further research into the thought that some players can mean big things for the right club.

The General Manager Position in MLS

During tonight’s podcast we will be talking a bit about the constructs of MLS offices. It’s easy to question the thinking behind transactions and player dealings. Each person has a specific idea behind the move and their own end game and plan that they wish to execute.  Personnel decision making is an important skill. We can find out more about some of the these skills if we actually know the individuals behind the desk of their respective clubs.

This list is far from exhaustive. The effort is to give a single point of reference for front office types in each MLS club. The problem behind this little pilot study is that not all them are singularly responsible for the decision making as there are others: CEOs, CFOs, Presidents and a myriad of others that help influence these decisions.

That said this is a good start to getting an idea as to who is pulling some of the strings when it comes to putting together the 30-man roster and dealing with the salary cap. The list is sorted according to the current (9/4) Supporter Shield standings.

LA Galaxy – Jovan Kirovski, Technical Director
Seattle Sounders – Adrian Hanauer, General Manager
Impact – Nick De Santis, Sporting Director/General Manager
NYRB – Andy Roxburgh, Sporting Director
Sporting KC – Peter Vermes, Team Manager & Technical Director
Philadelphia Union – Rob Vartughian, Coach & Technical Director
Colorado Rapids – Paul Bravo, Technical Director
Timbers – Gavin Wilkinson, General Manager
Whitecaps – Bob Lenarduzzi, General Manager & Team President
New Endgland Revs – Michael Burns, General Manager
Houston Dynamo – Nick Kowba, Director of Soccer Operations
FC Dallas – Fernando Clavijo, Technical Director
Chicago Fire – Javier Leon, President Soccer Operations
San Jose – John Doyle, General Manager of Soccer Operations
Columbus Crew – Brian Bliss, Technical Director
Chivas USA – Juan Francisco Palencia, Technical Director
Toronto – (formerly) Kevin Payne, General Manager & Team President 
DC United – Dave Kasper. General Manager
Personally, the three names that stand out to me are (maybe, unsurprisingly) Adrian HanauerRob Vartughian and Javier Leon (though admittedly there isn’t much on him). The three men are the only three to not have played professionally at any level. Something to think about and consider with these hirings.

The Chicago Fire and Goal Mouth Data

This is merely a trial run. I say that because in the last two days I’ve limited the collection of data and then expanded it. It comes down to how it tickles my fancy. The data I have collected is limited for the time being to the Chicago Fire as just a means of comparing a club and its data to the league and trying to make sense of it. This hopefully will develop into the means of how I can some how attribute value to clubs and their keepers in the future.

Below is a picture of the goal mouth, and the data has been collected from the website Sqwuaka.com. Coupled with a previously built image, you can see how Chicago compares to the rest of the league and how a majority of their goals have been scored this season. While numbers are always an important thing, remember that it’s more about ratios and the average occurrence than pure accumulation at this juncture. Not all teams have played the same amount of games and they haven’t had the same opportunities.  Shots+Goals and visuals

ChicagoFireHUD

In addition to the Goal Mouth visual, here is a field map diagram as it applies to the dimension of the field. This has already been provided in raw form in the data that Matty has collected and posted in the raw shot data tab, but I wanted to have another visual to compare the above data.

ChicagoFire-ShotField

The problem between the two is that there is no correlation between the fact that Chicago has allowed 4 goals in section 5 to the fact that they’ve also allowed 5 goals in SoT1 (for ease of the tally, I gave a numerical designation to each location on the goal mouth; starting at the top and working left to right). This is the next collaborative effort that I’m working on, gathering both the shot location of origin and placement on the goal, and from what specific individual at what time.

This is a very time-intensive task and it’ll probably take me the rest of the week to complete it just for Chicago. However, I’m taking suggestions on how I could compile this data without hand jamming it into a flat file. An SQL dump of the current Opta database for the season would go a long ways to helping compile this data and would be nice. But I’m never above a bit of hard work.

Thoughts?

Game of the Week: Montreal Impact at Chicago Fire

So why this game, you ask. Real Salt Lake is hosting Houston, and the Revs travel to play the Wiz, but I picked this game instead. Despite a negative goal differential, I like Chicago in this one. I smell upset. Our MLS tables tell me that Chicago ranks 5th in the league in attempts ratio at 1.07, earning nearly 10% more shot attempts than its opponents on average. When we account for where those shots are coming from, our shot location data suggests that Chicago’s goal differential should be pretty even: -0.04 expected goal differential (xGD) per game if I regress finishing rates 100%.

Basically Chicago is an average team with a little bad own-goals luck. However, as I’ve been preaching all year, Montreal’s play is seemingly unsustainable, and it is playing on the road. Despite the most points per game in MLS, Montreal owns the third-worst attempts ratio in the league, and an expected goal differential of -0.20 goals per game. The Impact may very well be the second-best team on the pitch come Saturday.

Chicago Fire Shots Data

For Locations Goals GoalDistr SOGDistr OffDistr BlksDistr AttDistr Finish% ExpGoals
One 5 19.2% 6.9% 2.6% 2.9% 4.2% 41.7% 4.0
Two 16 61.5% 31.7% 31.3% 17.6% 28.2% 20.0% 14.3
Three 3 11.5% 19.8% 16.5% 20.6% 18.7% 5.7% 3.2
Four 1 3.8% 22.8% 19.1% 25.0% 21.8% 1.6% 2.8
Five 1 3.8% 18.8% 28.7% 33.8% 26.4% 1.3% 1.6
Six 0 0.0% 0.0% 1.7% 0.0% 0.7% 0.0% 0.1
Total 26 26.0
Against Locations Goals GoalDistr SOGDistr OffDistr BlksDistr AttDistr Finish% ExpGoals
One 8 29.6% 11.5% 9.4% 2.0% 8.6% 34.8% 7.7
Two 9 33.3% 26.4% 29.7% 15.7% 25.9% 13.0% 12.3
Three 6 22.2% 23.0% 14.8% 31.4% 20.7% 10.9% 3.3
Four 0 0.0% 13.8% 13.3% 21.6% 15.0% 0.0% 1.8
Five 3 11.1% 21.8% 32.0% 29.4% 28.2% 4.0% 1.6
Six 1 3.7% 3.4% 0.8% 0.0% 1.5% 25.0% 0.2
Total 27 26.9
Luck -0.1

Montreal Impact Shots Data

For Locations Goals GoalDistr SOGDistr OffDistr BlksDistr AttDistr Finish% ExpGoals
One 4 12.1% 5.6% 1.1% 1.5% 3.0% 50.0% 2.7
Two 18 54.5% 30.6% 33.3% 25.4% 30.2% 22.5% 14.3
Three 5 15.2% 25.9% 18.9% 10.4% 19.6% 9.6% 3.1
Four 4 12.1% 18.5% 15.6% 23.9% 18.9% 8.0% 2.3
Five 2 6.1% 19.4% 31.1% 38.8% 28.3% 2.7% 1.6
Six 0 0.0% 0.0% 0.0% 0.0% 0.0% 0.0% 0.0
Total 33 23.9
Against Locations Goals GoalDistr SOGDistr OffDistr BlksDistr AttDistr Finish% ExpGoals
One 4 12.9% 5.9% 2.8% 2.9% 3.8% 33.3% 4.0
Two 15 48.4% 39.6% 32.4% 10.3% 29.9% 16.0% 16.7
Three 5 16.1% 14.9% 9.0% 11.8% 11.5% 13.9% 2.2
Four 6 19.4% 19.8% 13.8% 26.5% 18.5% 10.3% 2.7
Five 0 0.0% 18.8% 39.3% 45.6% 34.1% 0.0% 2.2
Six 1 3.2% 1.0% 2.8% 2.9% 2.2% 14.3% 0.3
Total 31 28.1
Luck 6.2