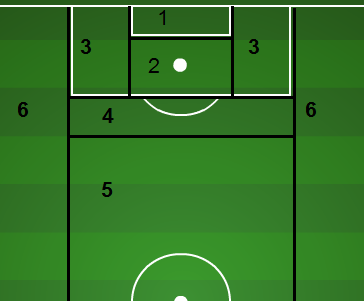
 I first introduced our shot location data here, and now it will be available every week! I broke the field down into six scoring zones (shown to the right), and I tallied shot-taking data from these zones. I will post updated league rates on this page in addition to luck charts. PK attempts are included in zone 2, but own goals have been left out.
I have a hunch that most teams’ finishing rates will tend to regress at least partway toward to the league’s average finishing rate within each zone, especially the finishing rates against. Thus the difference between goals and expected goals may imply some impending regression in the points table for some teams.
The Distribution columns (Distr) indicate the percentage of the particular events that come from the zone in question. For example, 54.9% of all goals are scored from zone 2 while only 30.7% of the attempts are taken from zone 2. It’s an efficient zone, though probably not quite as efficient if I were to remove PKs.
League Data (2013)
| Locations | Goals | GoalDistr | SOGDistr | OffDistr | BlksDistr | AttDistr | Finish% |
| One | 129 | 15.7% | 7.4% | 4.6% | 2.4% | 5.0% | 31.1% |
| Two | 451 | 54.9% | 36.8% | 31.5% | 20.7% | 30.7% | 17.7% |
| Three | 100 | 12.2% | 18.4% | 15.7% | 17.1% | 16.9% | 7.1% |
| Four | 85 | 10.4% | 17.5% | 17.2% | 25.5% | 19.2% | 5.3% |
| Five | 51 | 6.2% | 18.2% | 28.8% | 33.5% | 26.4% | 2.3% |
| Six | 5 | 0.6% | 1.8% | 2.1% | 0.9% | 1.7% | 3.5% |
If we regress each team’s finishing rates (for and against) back to league averages, we get the following table for goal differential (GD) versus expected goal differential (xGD). I have also included the components of GD and xGD.
“Luck” Table
| Team | GF | GA | GD | xGF | xGA | xGD | Luck |
| LA | 52 | 38 | 14 | 50.6 | 31.2 | 19.4 | -5.4 |
| SKC | 45 | 30 | 15 | 48.1 | 29.8 | 18.3 | -3.3 |
| SJ | 34 | 42 | -8 | 49.3 | 42.5 | 6.8 | -14.8 |
| COL | 43 | 38 | 5 | 45.1 | 39.5 | 5.7 | -0.7 |
| PHI | 42 | 43 | -1 | 48.2 | 42.8 | 5.5 | -6.5 |
| NYRB | 56 | 39 | 17 | 46.3 | 41.0 | 5.3 | 11.7 |
| HOU | 40 | 39 | 1 | 49.6 | 44.3 | 5.3 | -4.3 |
| POR | 53 | 33 | 20 | 42.8 | 40.1 | 2.7 | 17.3 |
| SEA | 39 | 42 | -3 | 44.3 | 42.8 | 1.5 | -4.5 |
| FCD | 46 | 49 | -3 | 44.1 | 43.3 | 0.8 | -3.8 |
| CHI | 46 | 49 | -3 | 47.5 | 49.4 | -1.9 | -1.1 |
| CLB | 41 | 46 | -5 | 42.6 | 44.7 | -2.1 | -2.9 |
| NE | 48 | 36 | 12 | 38.3 | 41.1 | -2.8 | 14.8 |
| RSL | 56 | 41 | 15 | 42.0 | 46.1 | -4.1 | 19.1 |
| MTL | 50 | 48 | 2 | 41.2 | 46.5 | -5.4 | 7.4 |
| VAN | 53 | 41 | 12 | 40.3 | 47.2 | -6.9 | 18.9 |
| TOR | 28 | 46 | -18 | 34.3 | 46.3 | -12.0 | -6.0 |
| DCU | 21 | 55 | -34 | 35.4 | 47.4 | -12.0 | -22.0 |
| CHV | 28 | 66 | -38 | 31.0 | 55.0 | -24.0 | -14.0 |

Pingback: Noisy Finishing Rates | American Soccer Analysis
Pingback: A Closer Look At The MLS MVP Race | American Soccer Analysis
Pingback: Top 100 American Goalkeepers (November 2013) | Everybody Soccer, Even the Goalkeepers Like to
Pingback: The Predictive Power of Shot Locations Data | American Soccer Analysis
Pingback: What Piquionne’s goal means to Portland | American Soccer Analysis
Pingback: This Week’s Sounders Article: Ozzie Alonso and Brad Evans | North and South of Royal Brougham
Pingback: Sounders Weekly — Don’t Worry, There Is Another | North and South of Royal Brougham
Pingback: Calculating Expected Goal Differential 1.0 | American Soccer Analysis
Hey, I noticed something odd about the Whitecaps numbers – GF is 53 (which we scored in 2013), but goals against is 41 (from 2012). We had 45 GA in 2013.
This data leaves out own goals on the assumption that they just cloud the predictive value of the data. Vancouver scored four own goals on itself on the dates of 3/30, 4/20 (he was probably high), 4/27 and 6/1. Vancouver never received an own goal gift from its opponents.
Oh, thanks, must have skimmed over that point above.
Pingback: Season Preview: New York Red Bulls | American Soccer Analysis
Pingback: Season Preview: LA Galaxy | American Soccer Analysis
Pingback: Season Preview: Sporting Kansas City | American Soccer Analysis
Pingback: Season Preview: Portland Timbers | American Soccer Analysis