Individual Defensive Statistics: Which Ones Matter and Top 10 MLS Defenders

When a car breaks down, a mechanic’s job is to tell you what caused the failure. He or she can generally pinpoint the problem to a specific part reaching the end of its useful life. But have you ever asked a mechanic why your car is working fine? Or which part deserves the most credit for your car running smoothly? Of course not. That would be a waste of everyone’s time. There are many parts to a car and all are doing their job as designed. We never ask why when things are going well.

The same dilemma exists in assessing soccer defenders. After all, most of how we assess defenders has to do with what goals were not scored. And when all the parts of the defenses are working as designed, goals are avoided. But which defenders deserve the credit when goals aren’t scored? It’s like the pointless car question, which parts of the car deserve the most credit when the car runs smoothly?

To even begin this conversation we need to take stock of what data exists for soccer defenders. And just to be clear, I am going to steer clear looking at a defender’s offensive capability. I want to focus solely on defensive statistics. Whoscored is the only site that offers a collection of defensive statistics, and here is what they have and their definitions.

  • Blocked Shot: Prevention by an outfield player of an opponents shot reaching the goal
  • Clearance: Action by a defending player that temporarily removes the attacking threat on their goal/that effectively alleviates pressure on their goal
  • Interception: Preventing an opponent’s pass from reaching their teammates
  • Offside Won: The last man to step up to catch an opponent in an offside position
  • Tackle: Dispossessing an opponent, whether the tackling player comes away with the ball or not

These are the defensive-oriented statistics offered by Whoscored that are tracked at the individual player level. Of course, the other vital defensive statistic is shots conceded but those can’t be attributed to any one player. So then, do any of these statistics matter? First there are a couple of assumptions to iron out.

A defender should be judged by the rate at which he accumulates statistics. So to get to that number we need to adjust these statistics to account for the time that the opponent has the ball. For example, Player A who averages 5 clearances per game might be better than Player B who averages 6 clearances if Player A’s opposition had the ball 20% less often. That would mean player A made more clearances given the opportunities provided to him. So I will adjust all metrics by opposition possession.

Since I am trying to assess what goals are not scored, I going to look at the numbers at the team level first. It is only at the team level that goals can be attributed. After that analysis I will attempt to attribute value to the individual metrics.

sources: whoscored, mlssoccer.com

sources: whoscored, mlssoccer.com

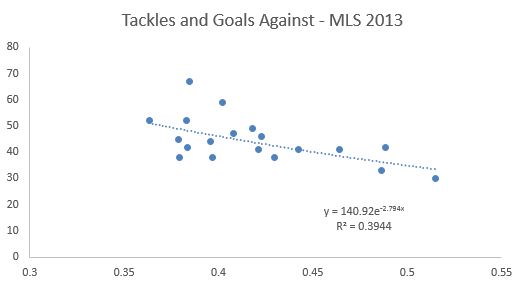
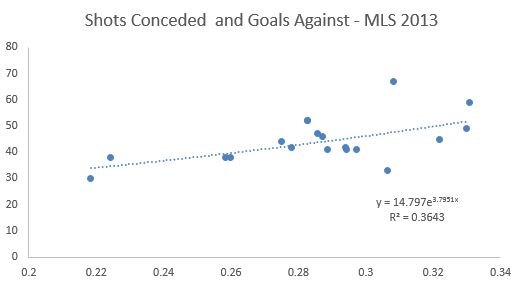
Here are tackles per game per minute of opponent possession against goals scored. Tackles represents the strongest correlation of all the variables. In fact, tackles has a slightly stronger correlation to goals against than shots conceded. Here is a look at the shots conceded as a percent of opponent minute of possession.

sources: whoscored.com, mlssoccer.com

sources: whoscored.com, mlssoccer.com

The two points to the far left represent the LA Galaxy and Sporting Kansas City. They appear adept at limiting shots on goal per minute of opposition possession. They also stand out when looking at offsides won.

Rather than show every graph, here is a table of the defensive statistics, their level of impact and the R squared of the impact in predicting goals against.

Statistic Goals Avoided per Unit R squared
Clearances -0.041 27.1%
Interceptions -0.036 15.1%
Tackles -0.077 39.4%
Offsides Won -0.113 16.0%
Blocks % of Shots -0.017 0.3%

Offsides won is the most impactful of the statistics (has the greatest slope) but there is a weaker correlation than Tackles or Clearances–in other words, there are greater deviations from the trend line. It’s interesting to see that Blocks as a percent of shots has almost no impact on goals allowed.

This is interesting, but what to make of it all? In an ideal world we could compile these statistics into a meaningful metric in order to compare players. The most obvious way to do that statistically would be to run a multivariate regression using all of the statistics.  The trouble with the result is that the statistics end up not being statistically significant predictors when mashed together. So developing a score from these metrics would be a bit of a fool’s errand.

The other option would be to ignore the predictive strength of the variables and just use the goals avoided results as a scalar, multiply them by each player’s statistics, add them up and compile a score. In this case the resulting score would be something we relate to as we could say that this player avoids x number of goals per game. However, this would give offsides won the statistic with the greatest importance despite the fact that the correlation is not strong.

To factor in the correlation we could leave the realm of sound statistical practice. We could multiply the goals avoided scalar by the R square. We could turn that into an index with the highest metric (tackles) equaling 1. If we did that here is the resulting table and values for each metric.

Statistic Goals Avoided per Unit R squared GApU x R2 Index
Clearances -0.041 27.1% -0.011 0.37
Interceptions -0.036 15.1% -0.005 0.18
Tackles -0.077 39.4% -0.030 1.00
Offsides Won -0.113 16.0% -0.018 0.60
Blocks % of Shots -0.017 0.3% 0.000 0.00

Tackles would be the most important statistic followed by offsides won and then clearances and interceptions. It turns out blocked shots have no material value in estimating goals against.

Before I use these numbers to reveal the top 10 MLS defenders, here are the caveats. Obviously this ranking is missing a few vital elements of defending in soccer. The first major omission is positioning. Often a defender being in the right position forces an offense to not make a pass that would increase their chance of scoring. There is no measurement for that but obviously a defender out of position is not a valuable defender. Clearances, interceptions, tackles and offsides won are clearing indicators that the player was probably in position to make the play and they indicate the player succeeding making the necessary play. But offensive attempts avoided are clearly missing.

The other major omission is the offensive play of the defender. A defender who defends well and represents an offensive threat is that much more valuable. But I’m not trying to solve for that here. I leave that for the subject of another post to integrate passing and offensive numbers to build a better score for defenders.

Here are the top 10 MLS defenders based on the score developed through the last week for players with a minimum of four appearances.

Rank Name Team Tackles Intercepts Off Won Clears Defender Score
1 José Gonçalves New England Rev. 1.6 2.4 2 11.2 7.376
2 Giancarlo Gonzalez Columbus Crew 2.1 2.9 1.9 9.3 7.203
3 Norberto Paparatto Portland Timbers 1.8 4.8 1.3 9.3 6.885
4 Carlos Bocanegra CD Chivas USA 1.5 3.6 2.1 8.9 6.701
5 Andrew Farrell New England Rev. 2.9 2.4 0.3 8.3 6.583
6 Jamison Olave New York Red Bulls 1.9 3.1 1.7 6.7 5.957
7 Victor Bernardez San Jose Quakes 1.5 2.8 0.7 9.5 5.939
8 Matt Hedges FC Dallas 1.5 3.9 0.9 8.5 5.887
9 Eric Avila CD Chivas USA 4 2.4 0.8 2.3 5.763
10 Chris Schuler Real Salt Lake 1.8 2.8 0.5 8.3 5.675

I find it comforting that, for a new metric, Jose’ Goncalves, MLS Defender of the Year in 2013, tops the list. There’s a big drop between the top 2 defenders and Paparatto. There’s also another cliff after Andrew Farrell. But hey, it’s a start.

I hope this was an enlightening ride through the mechanics of defending from a soccer perspective. The next time you’re watching a game, don’t just focus on the breakdowns. Also look for what makes the defense successful.


MLS Week 8: Top 50 Shots

Okay, shots. We talk a lot about shots because, well, shots lead to goals. Obviously you can’t have a goal without first attempting a shot. I know that was a deep thought, but just go with me here.

We put a lot of emphasis on shots here and have dug into their expectation leading to goals. It’s backed by the belief that shots are important statistics in correlation to team success. Now there are plenty of caveats to shots and we use them to influence our ideas of what is good or bad. Matthias has taken time to explain at least some of them.

So with all that said you can’t read too much into all of these numbers. Take for instance the fact that Frederico Higuian creates 7.03 shots per 90 minutes. That’s nearly a shot and a quarter more than Brad Davis at 5.79. Is Higuian a better shot creator because he creates one additional shot over the course of a single match? If that shot is from zone 4 or even 5, the value of that single shot becomes marginalized in that specific instance.

Despite all of those various acknowledgements of how this is marginally interesting, and yet mostly a useless exercise, I put together a follow-up of last week’s top 50 individual shots creators in Major League Soccer. I decided it was best to cut up this data and present it via a tiered system to make it a bit more palatable and to highlight the players that have set themselves apart from their peers. Also, this allows me to be a bit creative in the tier process.

IBC Root Beer Tier – “The Best of the Best.”

Player Club POS MINS G A SHTS Key Passes Sh-C Sh-C p90
1 Marco Di Vaio MTL F 326 1 1 24 4 29 8.01
2 Clint Dempsey SEA M 393 6 3 23 7 33 7.56
3 Federico Higuain CLB F 538 4 2 20 20 42 7.03
4 Robbie Keane LA F 450 4 1 22 12 35 7.00
5 Pedro Morales VAN M 472 1 2 19 15 36 6.86
6 Thierry Henry NY F 449 2 0 23 9 32 6.41

Oh, yeah… Marco Di Viao. He’s also pretty good at this whole soccer thing. I guess we can all say that we could have guessed every singl–what the hell is Pedro Morales doing in there??? I guess that probably explains a lot about what’s been happening in Vancouver. He’s second overall in total Shots Created and he could very well be a shoo-in for MLS Newcomer of the Year.  He’s like the offensive equivalent of what Jose Goncalves was last year to New England. I only have one question: who is this Camilo guy everyone was talking about?

Stewart’s Root Beer Tier – “You don’t have IBC? Who doesn’t have IBC?”

Player Club POS MINS G A SHTS Key Passes Sh-C Sh-C p90
7 Landon Donovan LA M-F 450 0 2 13 14 29 5.80
8 Brad Davis HOU M 311 0 2 3 15 20 5.79
9 Graham Zusi KC F-M 450 1 3 9 16 28 5.60
10 Diego Valeri POR M 579 1 0 19 16 35 5.44
11 Dom Dwyer KC F 427 4 0 22 3 25 5.27
12 Leo Fernandes PHI F 436 2 1 13 11 25 5.16
13 Lloyd Sam NY M 621 1 3 12 20 35 5.07
14 Mike Magee CHI F 450 1 2 15 8 25 5.00
15 Giles Barnes HOU M 527 0 1 22 6 29 4.95
16 Justin Mapp MTL M 585 0 3 11 18 32 4.92
17 Michael Bradley TOR M 433 1 0 6 17 23 4.78
18 Mauro Diaz DAL M 604 2 3 13 16 32 4.77
19 Quincy Amarikwa CHI F 548 4 1 16 12 29 4.76
20 Felipe Martins MTL M 626 1 2 18 13 33 4.74
21 Gilberto TOR F 423 0 0 13 9 22 4.68
22 Cristian Maidana PHI M 425 0 2 11 9 22 4.66
23 Deshorn Brown COL F 448 1 0 19 4 23 4.62
24 Chris Wondolowski SJ F-M 450 3 0 20 3 23 4.60
25 Fabian Espindola DC F 531 2 2 11 14 27 4.58
26 Michel DAL M-D 401 3 2 11 7 20 4.49
27 Lamar Neagle SEA F 506 2 2 16 6 24 4.27
28 Obafemi Martins SEA F 620 2 4 13 12 29 4.21
29 Erick Torres CHV F 603 6 0 22 6 28 4.18
30 Javier Morales RSL M 527 0 2 7 15 24 4.10

Justin Mapp has the same amount of total Shots Created as Mauro Diaz in almost 20 minutes less field time. Try thinking about that next time you’re frustrated by Mapp’s hair line. Try.

Dom Dwyer does not go away. This guy could be someone that we may need to start legitimately talking about in the coming weeks. You should probably add Leo Fernandez and Lloyd Sam to that obnoxious hype list too.

Speaking of Sam, I added him to my MLS Fantasy Roster for tonight, hedging the bet that he finally scores a goal. At last look, the guy currently holds the highest xGoal predictor score without actually scoring a goal. If there was ever a guy that was “due” to score a goal, it’s him and I’m virtually betting on it happening.

On the note of not scoring goals, “Hi, Landon Donovan“. Who, in case you didn’t notice, is still a good player even when not putting the ball in the back of the net. Because, you know, skillz.


Barqs Root Beer Tier – “Old Reliable”

Player Club POS MINS G A SHTS Key Passes Sh-C Sh-C p90
31 Dwayne De Rosario TOR M 254 0 0 10 1 11 3.90
32 Mauro Rosales CHV M 626 0 3 10 14 27 3.88
33 Kenny Miller VAN F 537 3 1 14 8 23 3.85
34 Bradley Wright-Phillips NY F 358 1 0 12 3 15 3.77
35 Darren Mattocks VAN F 580 2 3 13 8 24 3.72
36 Jack McInerney MTL F 436 2 1 13 4 18 3.72
37 Will Bruin HOU F 539 3 1 14 7 22 3.67
38 Baggio Husidic LA M 344 1 1 7 6 14 3.66
39 Bernardo Anor CLB M 497 2 0 16 4 20 3.62
40 Hector Jimenez CLB M 523 1 2 9 10 21 3.61
41 Teal Bunbury NE F 630 0 1 14 10 25 3.57
42 Diego Fagundez NE M-F 584 0 0 19 4 23 3.54
43 Sal Zizzo KC F 433 0 2 10 5 17 3.53
44 Kenny Cooper SEA F 358 2 1 12 1 14 3.52
45 Benny Feilhaber KC M 539 1 1 8 12 21 3.51
46 Juninho LA M 448 0 2 8 7 17 3.42
47 Andrew Wenger PHI F 528 2 0 14 6 20 3.41
48 Eric Alexander NY M 451 0 3 7 7 17 3.39
49 Alex CHI M 512 0 0 12 7 19 3.34
50 Saer Sene NE M 355 0 0 8 5 13 3.30


There are roughly 19 names here and I’m not going to go through them all. But key surprises are Jack McInerney, who everyone continues to think is “slumping” when he’s not scoring goals. Baggio Husidic is making waves in that flashy new diamond attack in LA. Husidic is filling the hole that once upon a time existed out wide and makes the Robbie Rogers-trade look worse and worse, as he likely won’t make it past a bench position upon return. Bernardo Anor has been doing a lot for Columbus out of the midfield but, perhaps, the bigger story than Anor–or even the LA trade for Rogers–is that fact that Gregg Berhalter pretty much stole Hector Jimenez who is looking brilliant in his new Crew colors.

Lastly, three other off season moves are having impacts with their new clubs.

  1. Teal Bunbury is finally being “the other guy” and taking shots in New England. Lord knows they need to start converting those opportunities.
  2. Sal Zizzo wasn’t exactly a headline move this off-season, but since being let go by Portland this past off-season he’s been a gold staple in the Sporting KC line-up.
  3. Kenny Cooper is having himself a quietly productive first season in the Emerald City. Yes, it’s towards the bottom of the line-up and it doesn’t really mean much of anything. But he’s been reliable and fits in with Clint Dempsey and Oba Martins, playing the third/fourth fiddle and doing whatever needs to happen. Great role for him and he’s doing it well.

There are a lot of things to take away from this. Like why didn’t I just make two tiers: IBC Rootbeer and Barqs, which is basically all you’re going to go with unless there is some local brewed Root beer that you want to try for funsies. Anyways, some information here. Not necessarily good information, but at this stage of analysis and data when it comes to MLS, and really soccer in general, what is “good” information?

Montreal and Philadelphia Swap Young Strikers

Okay, I’m sure by now that, given you follow our site, you’ve also probably been made aware of the fact that the Philadelphia Union (an underrated team in my opinion) traded their young 20-year old striker Jack McInerney to the Montreal Impact for their young 22-year old striker Andrew Wenger. The trade has a very Matt Garza for Delmon Young feel to it, leaving me with an odd taste in my mouth. Are the Montreal Impact selling low on Andrew Wenger? It’s, at the very least, presumable that they know something that we don’t about him and his nature. The question becomes, then, is that assessment accurate?

Obviously the idea of a poacher is one that is met with a bit of contention,  in the sense of how do you measure being in the “right place at the right time” for an individual? However assessing the 86 shots taken by ‘JackMac’ from the 2013 season, we can know that no fewer than 57 of them came from inside the 18 yard box, courtesy of digging around on the MLS Chalkboards. It’s obvious that he’s a player that can get the ball in advantageous locations. Already on the season he’s put together 12 shots and 11 of them have come inside the 18-yard box with 6 coming directly in front of goal. He’s been appropriately tagged on twitter as a “fox in the box”—hold the sexual innuendos—and I think the term poacher probably comes naturally with that association. Unfortunately, that term may harbor and imply the idea that he’s more lucky than good. I’m not sure I entirely buy that approach.


JmC-AWen

Meanwhile with everyone’s attention directly focused on McInerney–audaciously stamped as ‘The American Chicharito’–having already being called in the USMNT Camp for training during the Gold Cup, people are forgetting about Wenger and his potential that once made him a #1 overall MLS draft pick. Back in 2012, Wenger was painted as a potent and rising talent in MLS, named to MLSSoccer.com’s 24 under 24 roster, coming in 7th overall. Just one year later McInerney jumped onto the list himself, rocketing to 4th overall, while Wenger was left off. The perpetual “what have you done for me lately?” seemed to come out in these rankings.

Wenger–despite all his talent–has run into a slew of various injury-related setbacks the last two seasons; it’s so much failing to perform. The talent is still there, and I fully expect John Hackworth to tinker in an effort to get as much out of him as possible. The easy narrative here might just be the returning home to “revitalize his career” or something like that. Instead I think Philadelphia possibly got an undervalued piece in this move.

Looking at the last two years and a total of 31 shots Wenger has taken, 24 of those came from inside the 18-yard box, a higher percentage than that of JacMac. With that you can see above with xGpSH (expected goals per shot) that Wenger’s average shot has been more likely to become a goal than that of his counterpart. Now, understand that this all comes with the requisite small sample sizes admission. Wenger has played less than half the amount of time as McInerney and has less than half the amount of shots. However, estimations based upon their current performances with creating shots has them near the same level as that of Eddie Johnson, Will Bruin and Chris Rolfe in years past.

Creating shots isn’t everything. Creating shots in important positions is something. As we attempt to analyze the value of certain events on the pitch and how certain players are responsible for those events, we’ll see some things and maybe understand how to assess performances. It’s easy to overact to certain things that come with doing this type of analysis— Such as McInerney, Wenger, Bruin and Rolfe all averaging about 4.0 shots created per game individually. That seems rather important, but there is additional data that is missing. How much was each shot that they created worth? What other attributes do they bring to the match? This is just an simple break down between two players and comparing how they’ve impacted their respective clubs.

Personally, looking at all of this data, I’m of the mindset that Montreal got the better player. However, it’s extremely close and that isn’t taking into account the rosters in which they are joining or how they might be utilized on the pitch with their new teams (4-3-3 concerns vs. 4-4-2 placement). I would say at this time the difference between the two is that one is younger and has more experience. That might be a bit simplistic approach but honestly both create shots the same way in the same space. McInerney does so at a higher rate but Wenger has made up for taking less shots with taking advantage of his more experienced partner, Marco Di Vaio, and feeding him opportunities.

This may be one of the more interesting trades in recent memory. I’m fascinated to watch what happens next and how each of these two players develop. Their career arcs will go a long way in providing the narrative for this trade and I’m not so certain that this is as one-sided as some people might think. Referencing baseball again, the Tampa Bay (then, Devil) Rays were largely regarded as having “sold low” on Delmon Young. We can now see, looking over the past decade,  that he never managed to put together all those tools that we once believed he had. The lesson being: don’t be too quick to judge Philadelphia. This isn’t necessarily going to be something as easily evaluated by just a single season, and time will reveal the significance of this day.

D.C. United: Shooters, Providers and What?

As you might have seen from our twitter stream, I kind of wrote an article on DC United last night. Then I scrapped it. Then, Alex Olshansky dropped this brilliant mess concerning Michael Bradley, and I was like “that’s basically what I was doing… on a team level!” So it kind of nudged me to at least put forth an effort to finish it…only not really.

What I did was basically compiled stats for four “core” attacking players on three different clubs. Two of those clubs (Sporting KC and Houston Dynamo) have shown consistent success the last two years, while D.C. United…well, you know, they have kind of stunk the place up.

The rest I submit to you without further inane commentary.


D.C. United

DC-Four

SH=shots, KP=Key Passes
SH/KP = Shots/key passes ratio
ShCPG =Shots created per 90 minutes played
%ofTeam= the total percentage of the teams shots that the individual created


Houston Dynamo

Hou-Four

SH=shots, KP=Key Passes
SH/KP = Shots/key passes ratio
ShCPG =Shots created per 90 minutes played
%ofTeam= the total percentage of the teams shots that the individual created


Sporting Kansas City

SportingKC-Four

SH=shots, KP=Key Passes
SH/KP = Shots/key passes ratio
ShCPG =Shots created per 90 minutes played
%ofTeam= the total percentage of the teams shots that the individual created

Introducing Expected Goals 2.0 and its Byproducts

Many of the features listed below from our shot-by-shot data for 2013 and 2014 can be found above by hovering over the “Expected Goals 2.0” link.

Last month, I wrote an article explaining our method for calculating Expected Goals 1.0, based only on the six shot locations. Now, we have updated our methods with the cool, new, sleek Expected Goals 2.0.

Recall that in calculating expected goals, the point is to use shot data to effectively suggest how many goals a team or player “should have scored.” This gives us an idea of how typical teams and players finish, given certain types of opportunities, and then allows us to predict how they might do in the future. Using shot locations, if teams are getting a lot of shots from, say, zone 2 (the area around the penalty spot), then they should be scoring a lot of goals.

Expected Goals 2.0 for Teams

Now, in the 2.0 version, it’s not only about shot location. It’s also about whether or not shots are being taken with the head or the foot, and whether or not they come from corner kicks. Data from the 2013 season suggest that not only are header and corner kick shot totals predictive of themselves (stable metrics), but they also lead to lower finishing rates. Thus, teams that fare exceptionally well or poorly in these categories will now see changes in their Expected Goals metrics.

Example: In 2013, Portland took a low percentage of its total shots as headers (15.4%), as well as a low percentage of its total shots from corner kicks (12.3%). Conversely, it allowed higher percentages of those types of shots to its opponents (19.2% and 15.0%, respectively). Presumably, the Timbers’ style of play encourages this behavior, and this is why the 2.0 version of Expected Goal Differential (xGD) liked the Timbers more so than the 1.0 version

We also calculate Expected Goals 2.0 contextually–specifically during times periods of an even score (even gamestate)–for your loin-tickling pleasure.

Expected Goals 2.0 for Players

Another addition from the new data we have is that we can assess players’ finishing ability while controlling for the various types of shots. Players’ goal totals can be compared to their Expected Goals totals in an attempt to quantify their finishing ability. Finishing is still a controversial topic, but it’s this type of data that will help us to separate out good and bad finishers, if those distinctions even exist. Even if finishing is not a repeatable skill, players with consistently high Expected Goals totals may be seen as players that get themselves into dangerous positions on the pitch–perhaps a skill in its own right.

The other primary player influencing any shot is the main guy trying to stop it, the goalkeeper. This data will someday soon be used to assess goalkeepers’ saving abilities, based on the types of shot taken (location, run of play, body part), how well the shot was placed in the goal mouth, and whether the keeper gave up a dangerous rebound. Thus for keepers we will have goals allowed versus expected goals allowed.

Win Expectancy

Win Expectancy is something that exists for both Major League Baseball and the National Football League, and we are now introducing it here for Major League Soccer. When the away team takes the lead in the first 15 minutes, what does that mean for their chances of winning? These are the questions that can be answered by looking at past games in which a similar scenario unfolded. We will keep Win Expectancy charts updated based on 2013 and 2014 data.

MVP Discussion: Soccer shares baseball’s issues

In the wake of Major League Baseball awarding its MVP to Miguel Cabrera, debates over what “valuable” means have once again flared up. Though soccer and baseball are two incredibly different sports, I think we can apply some of the same logic to both MVP discussions. Major League Soccer has about two weeks remaining before its MVP award is handed out, and we will no doubt encounter many of the same controversies in the soccer blogosphere that appear in baseball every season.

The MVP controversy usually begins with what “valuable” means. I think there’s little doubt in most people’s minds that “valuable” and “skilled” are correlated. The main controversy is how correlated. To some, asking who was the best player in Major League Soccer in 2013 would be equivalent to asking who was the most valuable to his team. To others, there would be some key distinctions, the most common of which is that MVPs must come from teams that reach the post season.

In retort to that thinking, some very astute commenters in a Fangraphs.com forum offered up these nuggets. Hendu for Kutch made the analogy:

“We each want to buy something that costs $1. I’ve got a quarter, 8 nickels, and 10 pennies. My ‘team’ of coins is worth 75 cents and falls short of being able to buy the item. You have one dime and 18 nickels. Your ‘team’ is worth $1, and you successfully buy the item. Is your dime more valuable than my quarter simply because it led to a successful item purchase?”

Mike Trout = quarter and Miguel Cabrera = dime, for those of you not so into baseball, and the question is a good one. Few would argue that the dime is more valuable than the quarter just because it found itself in a position to help buy that scrumptious Twix.

In reply to someone arguing that the quarter had no value because it didn’t lead to the purchase of a desired item, BIP and ndavis910 then chimed in:

“Except not everything costs $1, and at any rate, you would always choose the quarter over the dime when accumulating money for a purchase.”

“Especially when you don’t know the cost of the items until you get to the store. In baseball, a team cannot be sure how many wins it will take to reach the playoffs until the last day of the season. In your example, the quarter is the most valuable piece regardless of whether or not the item cost $1 or $0.75.”

When thinking about attributing value to players like Marco Di Vaio, Mike Magee, Camilo Sanvezzo, Robbie Keane and company, why should it matter where their teams finished? If one believes that Magee, for instance, is the best player in MLS, then does it matter if he took his team from 39 points to 49, versus from 40 points to 50? Either way, it’s still ten points of value in the standings. When Magee was traded to Chicago, neither Chicago nor Magee knew that the Fire was going to need 50 points to make the playoffs. The fact that they got just 49 points shouldn’t negate any of Magee’s value.

If you say that it matters because MLS clubs get real value from extra playoff games, then think about this. Playoff cutoff lines are quite arbitrary. If MLS allowed only the top two teams in from each conference—not completely unreasonable for a league of just 19 teams—then none of the players mentioned above would be considered under this playoffs requirement. Playoffs represent an arbitrary bar that the players competing for the award don’t get to set, and while reaching the playoffs does bring the team measurable revenue and value, basing an award on something outside an individual’s control would, in my opinion, strip the award of its intended meaning and purpose.

Now let’s anticipate the logical counterargument—that players pick up their games in playoff races and play well when it matters most.

For a moment, let’s ignore the fact that little evidence has ever been found in professional sports that players can turn it on and turn it off as needed. This past season, Magee scored seven goals in Chicago’s final nine games, a stretch in which the team averaged 1.56 points per match. That represents a pace that would have gotten the Fire into the playoffs if maintained for the entire season. Di Vaio scored five goals in his last 10 games—I even included that tenth-to-last game in which he scored two goals—in a stretch where Montreal tallied just 0.7 points per match, limping into the playoffs on a tie-breaker with Chicago. Just because one team makes the playoffs doesn’t mean its best player was at his peak when it mattered. Goals are, admittedly, a narrow-minded way to measure a striker’s value, but I think the point is still valid.

For me, the Magee-Di Vaio example above may have been no more than an exercise in confirmation bias. I chose to see what I already believed. However, the logic behind the belief that team standings shouldn’t matter to players’ MVP merits is still good stuff, and transcends any biased example I can come up with.

If we’re ready to agree that that the MVP award should essentially be given to the best overall player, then we still have a tall task ahead of us. How do we measure skill on the soccer field? That is the 64,000-dollar question, and one we hope to help tackle here at ASA some day. But perhaps it’s not so crazy to think that a guy like Federico Higuain is deserving of the MVP award. If you scoff at that notion, you likely do so because you’ve been trained to think about MVP awards in a certain way.

We’re all about re-thinking things around here.

ASA Podcast XXIX: Of flip phones, semifinals, USMNT, pass completions, and burrito folding.

This week we talked about how cool and hip we are, followed by a discussion of the first legs of the MLS Cup semifinals. We continued with potential changes to MLS’ CONCACAF Champions League births, Klinsmann’s 23 man roster for the upcoming friendlies versus Scotland and Austria, and the top 50 players in MLS by pass completion percentage. We concluded with a discussion of burritos and proper burrito folding practices.

Rosales, not Dempsey, is the clear choice for Seattle’s set-piece crosses

In Seattle’s 2-1 loss to Portland on Saturday, Clint Dempsey took all of the Sounders’ attacking set-pieces in the first half. He was impressive with his free kick shots on goal, clipping the crossbar and forcing Donovan Ricketts into multiple saves. But his corner kicks left much to be desired. Mauro Rosales subbed on in the 63rd minute and took the remainder of the set-piece crosses and created more chances.

With Lamar Neagle suspended for yellow card accumulation and Seattle needing goals in leg two, Rosales seems likely to start. Requisite warning about small sample sizes aside, based off of the results in leg one, the data suggest Sigi Schmidt would be wise to let Rosales take over set-piece crossing duties in the second leg.

Here’s how Dempsey’s nine corners and one free kick cross went in leg one:

DempseyLeg1FKs

3rd minute corner: To the near post, cleared by Diego Chara
6th corner: Near post, cleared by Will Johnson
20th corner: Near post, cleared by Will Johnson
25th corner: Near post, cleared by Chara
32nd corner: Near post, cleared by Chara
38th corner: Top of the six yard box, cleared by Pa-Moudou Kah
38th corner: Top of six, cleared by Kah
39th free kick: Cross from 18 yards out on the wing to the top of the six, cleared by Futty Danso
45th corner: Near post, punched clear by Ricketts

In the second half, Rosales took all three Seattle corners and two free kick crosses:

RosalesLeg1FKs

68th minute corner: To the penalty spot, shot by Djimi Traore, saved by Ricketts
69th corner: Top of six, Headed cross by Dempsey  blocked by Zemanski and eventually caught by Ricketts
82nd free kick: Cross from 38 yards in the center to the penalty spot, cleared by Danso
86th free kick: Cross from 28 yards on the wing to the edge of the penalty box, headed by Shalrie Joseph across the box
87th corner: Penalty spot, Headed shot by Dempsey off of the crossbar and out

In summary: Dempsey had 10 set-piece crosses, none of which reached a Seattle teammate. Rosales had five set-piece crosses, four of which found a teammate in the box, and three of which led to shots.

As you can tell, it was a tale of two halves. In the first, Dempsey’s crosses rarely cleared the first defender, and none found another Sounders player. In the second half, four of Rosales’ five crosses created chances, two off of the head of Dempsey himself.

If Seattle is going to win at Jeld-Wen Field on Thursday, they’ll need to do better with their crosses. Based on their chances in game one, it looks to be in the Sounders’ best interest to allow Rosales to take the free kick crosses in game two. Not only did his crosses create better chances than Dempsey in game one, but Deuce seems to be more dangerous getting on the end of crosses than he is at taking them.

Show Down: Juan Agudelo vs. Diego Fagundez

During our podcast on Thursday night, a short side conversation was sparked between Drew and me. Who would you take in a situation where you are starting a new team: Juan Agudelo or Diego Fagundez. While the question and how it’s presented matters (i.e. how many years of control do you have, salary cap situation, blah, blah, blah) because it gives us context, let’s not go there. The discussion here is more about the general response. We’ve all, myself included, just generally assumed that the answer to any question between the two is: “Agudelo now, Fagundez later”. But what makes us think that Fagundez isn’t the better option right now?

While doing our podcast I generally have between 9 and 15 browser tabs open with general bits of information. I’m sure my wife would argue that it’s more like 50. Whatever. It’s a lot. During that point in the podcast, I had Squawka up and quoted a total performance score of 452 for Fagundez, as opposed to Juan Agudelo and his shockingly low score of only 57.

So, the response then transforms itself from the answer that we thought we were sure of, to understanding what exactly Agudelo has done over the course of the season. Trust me, I get that numbers, especially in soccer, can’t tell an entire story. But they can help see us things that our brains don’t naturally keep track of.

Agudelo, in my mind, is a special case of a lot of talent doing one specific thing and being credited for far more than perhaps initially thought. I know the other side of that argument stresses his physical traits and goal-scoring ability. Sure, those are two HUGE things when it comes to this game. Speed kills and Agudelo knows how to turn it on.

Let’s take a look below.

Mins Goals Shots Goals pSh Chances Created
Fagundez 2419 13 43 0.30 27
Agudelo 1019 7 17 0.41 4

First, we can see one thing. And it’s quiet amazing. Together, the two players produced 20 goals on 60 shots. Take a second to think about that because that’s major. The Revolution took 37 shots and scored just one goal over their first five matches of the season. These guys get thrown into the line-up and procure 20 goals on just 60 shots. That’s special.

Second, what is most obviously the difference between the two is the number of chances created. You’ll see in a second that Agudelo still made a fine amount of passes. The issue isn’t that he’s a ball hog, or that he just wants the chances for himself. The problem is those passes did not become chances on goal. You’d hope that a guy who gets plenty of attention from the defense has the ability to find open teammates that can create goals.

Mins Pass p90 TO p90 Pass pTO Avg Length Dribbles DisPos per 90
Fagundez 2419 22.17 2.08 10.65 14m 0.86 1.71
Agudelo 1019 28.52 3 9.51 13m 0.53 2.91

Alright, onto the possession-based stuff. There are some interesting thoughts here. Such as Agudelo taking less dribbles, making shorter passes, and making more of them. It’s not something that I would have generally have thought of about him. I think of an individual who is looking to constantly run at defenders, but maybe that isn’t the whole picture. That said, he’s still losing the ball quiet a bit, and while Fagundez doesn’t make as many passes, he’s less error-prone and creates more pockets of space up the field with the ball at his feet.

Mins Fouls Cards Tackles Blocks Interceptions Clearances
Fagundez 2419 0.81 3 1.3 0.11 0.74 0.33
Agudelo 1019 3.53 2 1.4 0.09 0.35 0.71

The biggest number that stands out to me on this page is the number of fouls committed per 90 minutes by Agudelo. There is no way he makes that many fouls and continues to only pull about 6 cards over the course of a full season. That’s impossible. Outside of that, you see that each of these players is rather close to one another. One is a bit more on top of clearances while the other interceptions.

Really, that’s probably due to two random factors. 1) Agudelo is in the middle of the box more often for corner kicks, and 2) Fagundez works in the midfield where errant passes are more probable.

It’s important to realize these players aren’t like for like. Trying to compare them as apples to apples isn’t going to work and makes this work less productive. I am willing to acknowledge that. Agudelo did have some opportunities in the midfield this season, however, he was primarily featured up top in the striker role. Likewise, Fagundez had some exciting moments playing center forward, but was primarily used out wide as a left midfielder.

Because they don’t occupy the same space, certain statistical attributes that we associate with these players are going to be either more or less inflated. They have different responsibilities so they aren’t going to be the same player statistically. We don’t have a “Wins Above Replacement” calculator, as awesome as that would be.

There is no key that unlocks all events and makes them equal, as if to say this player is better than that player, regardless of position or team. Maybe this post was a complete waste because we should be comparing these two teammates to the rest of the league, rather than to each other. What I do know is that Fagundez is less a player of the future and more of an MLS standout now, but when Agudelo leaves for Stoke, he is still going to be missed by the Revs.

How Much Difference Did Kei Kamara Make To Sporting Kansas City?

I spent some time this week riding a few planes and doing my cross-country travel thing with the family. That means a lot of distractions, which in turn leads to time reading nerdy books and listening to podcasts. I’m not sure if it was just that the Sporting KC machine was on full crisis mode or what. I happened to catch 4 different podcasts (including our own…btw what a job Drew & Matty did without me, huh? Proves I’m expendable…)  talking about Sporting and their lack of ability to facilitate a goal in the Champions League at home. Obviously that’s a big deal, in part because they look to be one of the teams that will proceed on to the quarter finals next spring and continue to represent MLS.

But despite them sitting pretty in the CCL and third (using points per game) in the table for the Supporter Shield, a couple of podcasts basically forecasted that they would fall a part without a “proven scorer” now that Kei Kamara has departed. Now, I have to say that I’ve been mildly impressed with them as a team, and their pack of forwards—featuring Claudio Bieler, Soony Saad, CJ Sapong and the recently returned Dominic Dwyer—make for an interesting four-some. That isn’t including Teal Bunbury who made his return to the club after being out for a year-long rehab with a torn ACL.

My immediate reaction two weeks ago was to question the transfer the deadline deal and transfer of Kamara three weeks ago. I spent a day putting some thoughts together and then second-guessed myself that I was maybe naive. They’ve got quite a few weapons, and the added play of Benny Feilhaber—who admittedly I’ve never been a fan of—stepping into the void left by the departure of a six-foot, three-inch winger from Sierra Leone has been big. Their string of results (9 points in 3 games) made me think I was being silly.

Then today, while on the road from Atlanta, a thought crossed my mind and I decided that I would take a closer look at the numbers. I collected shot data for the matches Kamara participated in (and to the minute he was subbed in) as well as the games Sporting played without him, and I built myself a nifty little spreadsheet.

Now, before I throw these numbers at you, there is the need for a little asterisk to all this work. I’m sure it’s already understood, but if not, let me make it clear: these numbers are very vague and there is still quiet a bit of noise involved. How much, I’m not sure. It’s just important to recognize the difficulty of trying to measure what a team does with and without a single player, and extract the difference. I would love to quantify everything, but everything is currently unavailable. This is a very simple method in a very small sample size of a context.

To the numbers!

With Kei Kamara…

Total Minutes 1026
SHOT RATIO 2.171
KP RATIO 1.940
Goals per 90 1.930
Goals Allowed per 90 1.316
Points Per Match 1.67

And then again… only without him.

without Kamara
Total Minutes 1584
SHOT RATIO 1.527
KP RATIO 1.793
Goals per 90 1.193
Goals Allowed per 90 0.739
Points Per Match 1.63

You can see pretty the numbers plainly that the are overwhelmingly in the favor of Sporting being a better team with Kamara. And I don’t think anyone would argue against it. However, the difference between the two teams should be questioned as it’s possible the numbers are a result of the different system in which coach Peter Vermes implements with Kamara opposed to how he configures the team without his former star forward. I think the big stat that stands out to me is the number of goals allowed per 90 without Kamara in the starting XI. Which is pretty crazy, considering that the club actually surrenders less shots with Kamara in the line-up: 6.7 with vs. 7.4 without. This is what leads me to believe that A) the team plays a different style without him and B) that it may not be sustainable.

I wasn’t on the crazy train with thinking that Sporting has all these problems and is going to eventually fall apart. I’m still cautious enough that I’m still waiting to see if they’ll make a move towards the Supporters Shield with their remaining 5 matches in the season. Their shot ratio, even without Kamara, would still be best in all of MLS. So it’s hard to simply throw crazy statements that this team is that much worse without him.

The bigger issue at hand for me is that Sporting was a force with Kamara. Without him, they’re simply another good team in league filled with good teams. Both are sets of clubs (with and without Kamara) that are capable of winning silverware. That said, this really leads you to question why Vermes would sell off such a significant difference-maker overseas with a real shot at making a run for multiple cups at this point in the season.